
# Welcome to the Secutify Solo Risk Assessment documentation!
Congratulations on choosing SECUTIFY Solo.
# About Secutify Solo?
Secutify Solo is a software tool for creating risk assessment documentation in accordance with the requirements of EN ISO 12100, such as those required for the CE marking of machinery (Machinery Directive 2006/42/EC). Secutify helps you to meet the requirements of the safety standard EN ISO 12100. This enables you to create risk assessments for your machinery and plants in an efficient and safe way.

# Features
# Risk assessment according to the standard
Secutify Solo meets the requirements of the international security standard EN ISO 12100.
The model for creating the risk assessment is represented as an iterative process. You can switch between the individual process steps at any time, for example to add information or to record newly discovered hazards.
- Determine the limits of the machine
This is where the basic conditions for the use of the machine are defined. For what and by whom is it used, in which context and under which boundary conditions (e.g. climatic, local, timely). 2 Risk analysis
Determination of hazards for all phases of life and tasks/operating modes - Risk estimation
based on the extent of damage and probability of occurrence 4 Risk assessment
the decision whether risk reduction is necessary or not - Risk reduction
Find solutions to reduce or eliminate the risk
# Easy to use
Secutify supports you optimally by guiding you step by step through the process of creating the risk assessment and thus enables you to systematically build up your documentation in an iterative procedure. Of course, you can decide for yourself how fast or detailed you want to proceed.
# The risk graph
The risk graph is a useful tool for determining the risk present on the machine. With the risk graph, Secutify provides you with a proven method for evaluating risks. With it, the risk of a plant or machine can be assessed before and after the application of risk reduction measures.

For protective measures that depend on a control system, the required performance level (PL) can also be determined using the risk graph of the EN ISO 13849 standard.
# Report function
With the report function, the risk assessment can be output as a clearly arranged verification document. The basic information on the applied procedure is already included.
# Catalog management
Catalogs offer the possibility to manage important information, terms, images or files independently of the individual risk assessment. The information stored in the catalogs can be selected at various points in the risk assessment. This means that important information such as standards, guidelines or safety signs is always available.
Secutify comes with ready-made system catalogs for guidelines, standards, tasks, hazard consequences or safety signs. You also have the option of creating your own catalogs and adapting them to the needs of your business.
# Attachments
The risk assessment is an important part of the technical documentation for the CE marking according to Machinery Directive 2006/42/EC. With Secutify you can not only document your safety concept, but also attach important verification documents such as design drawings, measurement results or safety data sheets.
# The user interface
The user interface of Secutify Solo is organized along five main areas:
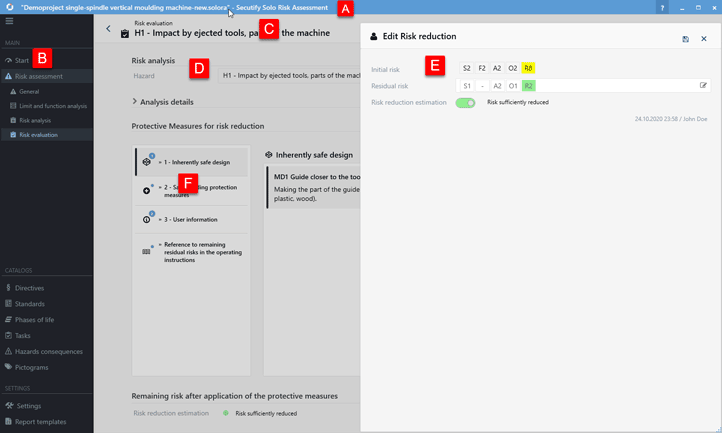
A Title bar
The title bar shows the name of the application and the name of the currently open file. The button  takes you directly to the online help.
B Navigation area
The navigation area is divided into the sections MAIN, with main and submenu for risk assessment, CATALOGS and SETTINGS.
C Header
The header bar shows the currently open program function, the navigation path (breadcrumb) and the Back button. If a report is available for the currently opened program function, the Create Report button is displayed.
D Display area
The display area shows the program function data. The sections can be edited individually using the Edit  button.
E Edit-Flyout
Data can be changed in the flyout, and the Save  button is used to save the changes.
F Register cards
Register cards subdivide the input areas of the program window to make them more clearly arranged. The blue badges  show how many entries have already been added to the list. A blue dot
  indicates that no entries have been made in the list yet.